ROMLAB: Trading Strategy Simulation Software

27 million backtests in seventeen minutes, and a straight answer at the end of them.
How do you know a trading strategy actually works, or whether it only happened to work once?
Our client was running an automated trading system with real capital behind it. The settings driving it had never been tested, because there was no practical way to test them. We built the laboratory that made the question answerable.
The problem
Real money was moving on settings nobody had ever tested.
The client ran an automated trading system. When his charting platform produced a signal, a program placed a live order on the exchange and moved his entire balance in one direction or the other. All in, or all out, on a single speculative instrument.
The settings behind every trade had been chosen by eye and never tested.
Signals could fire part way through a candle, before the session had closed.
One instrument, one timeframe, and no evidence that either was the right choice.
Results were disappointing, and nothing in the system could say why.
Why it could not be solved by hand
One hundred and fifty combinations, and months of live capital to test each one.
The guidance he had been given was sound, but it arrived as ranges rather than values. Two settings with a spread of plausible options each work out at roughly one hundred and fifty combinations for a single instrument, before adding a trend filter and before deciding which instrument to trade at all.
Time. Tested the only way available, one combination at a time on live capital, it is a lifetime of work.
Coincidence. Pick the best of one hundred and fifty results measured against thirty trades and something will always look spectacular. Give a coin to one hundred and fifty people and one of them flips ten heads.
Costs. The exchange charges a fee on every buy and every sell. A system trading often in a cheap instrument can hand its whole profit straight back, and a test that ignores that returns a number nobody could ever have achieved.
What changed
Months of live capital became seventeen minutes of simulation.
We rebuilt the signal logic as a standalone program, verified against the charting platform signal for signal, then replayed it over years of historical prices for every instrument under consideration.
Before
One combination tested at a time
Months of live trading for a single answer
Real capital at risk to learn anything at all
Profit measured before trading costs
No way to know whether simply holding would have done better
After
Every combination tested at once
Seventeen minutes for the full answer
Nothing at risk but disk space
Real exchange fees and order book costs charged on every fill
Buy and hold reported beside every single result
When the honest answer is that a configuration does not work, it now arrives as a line in a report rather than as a number on a statement.
- 01Pine Script to Python Translation
- 02Backtesting Engine Development
- 03Parameter Sweep Architecture
- 04Parallel Simulation at Scale
- 05Execution Cost Modelling
- 06Statistical Ranking and Anti-Overfitting
- 07Desktop Application and Interface
- 08Live Market Data Integration
- 01Pine Script to Python Translation
- 02Backtesting Engine Development
- 03Parameter Sweep Architecture
- 04Parallel Simulation at Scale
- 05Execution Cost Modelling
- 06Statistical Ranking and Anti-Overfitting
- 07Desktop Application and Interface
- 08Live Market Data Integration
At a glance
27M
simulations completed in a single seventeen-minute run
23
moving-average types ported from Pine Script, function by function
20,608
parameter configurations tested per market, per candle size
The translation
Pine Script is a charting language. It was never built to be a laboratory.
The strategy existed as a charting platform indicator, over five hundred lines of Pine Script that drew arrows on a chart. Before any of it could be tested at scale, every line had to become Python that behaves identically. Including the parts that are wrong.
That last part is the discipline. Pine Script treats missing data as na, and any comparison against it is false, so our port renders warmup as NaN rather than zero. Zeros look like real prices and produce plausible looking rubbish. The original indicator's long stop loss sits at a price of zero and can therefore never trigger. We replicated that faithfully and documented why, rather than quietly correcting it and handing back results for a strategy the client had never actually run.
The source defines its twenty-three moving average types three times over, once per slot. We implemented each of them once, and pinned the two places where Pine Script's integer division silently truncates. That is the difference between a Hull moving average that matches the chart and one that is subtly, invisibly wrong.
We also measured the compiler's fast maths optimisation and switched it off. Across five hundred values it changed every one of them, and bought nothing back in speed. Exactness was the point here. The speed came from somewhere else entirely.
The engine
Twenty-seven million simulations, and every one of them auditable.
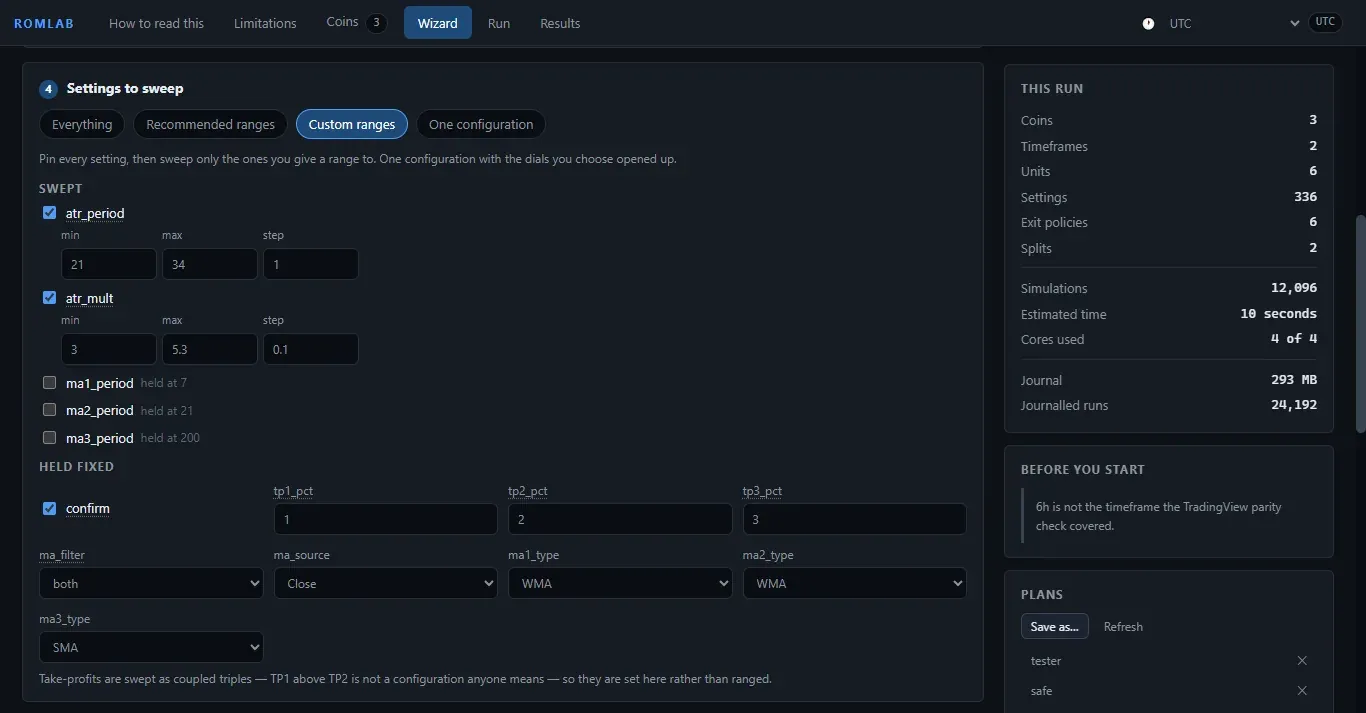
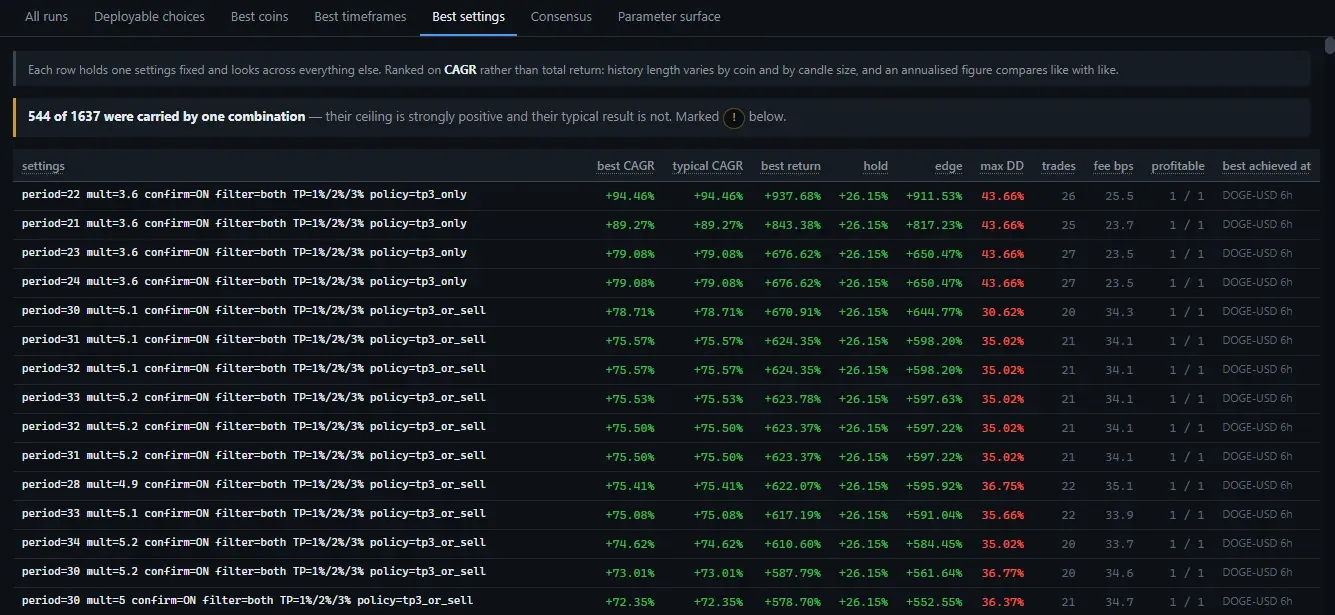
A full sweep tests forty-six ATR periods against fifty-six multipliers, two confirmation modes and four entry filters. That is 20,608 signal configurations for one market at one candle size, and each of those is then replayed through six exit policies and four take-profit ladders, across every market and timeframe in the plan.
The architecture is the loop. Signals are generated once per configuration and reused across every exit policy, a twenty to fifty fold saving, written so that it is structurally impossible to throw away by accident. The numerical kernels are compiled to machine code, and the work is parallelised across markets in separate processes, each owning its own output file so an interrupted run resumes cleanly instead of starting again.
In testing, that reached 27 million simulations in seventeen minutes. The runtime estimate the application shows before you commit is calibrated from complete runs rather than isolated benchmarks. An isolated benchmark suggested double the real throughput and quoted about eight minutes for a run that took seventeen. It now quotes the truth.
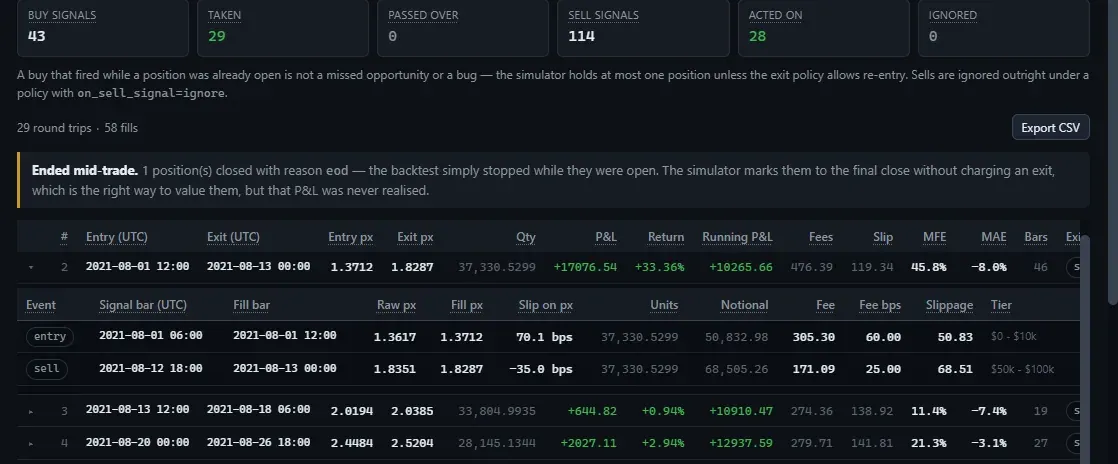
Every run can also write a full journal: every signal, every fill, and the fee and slippage each one paid. It is by far the largest thing a run produces, so the planner prices it live, with projected disk usage updating on every keystroke, and leaves the decision with the person spending the disk.
The honesty
The hard part was never the speed. It was refusing to give a confident, useless answer.
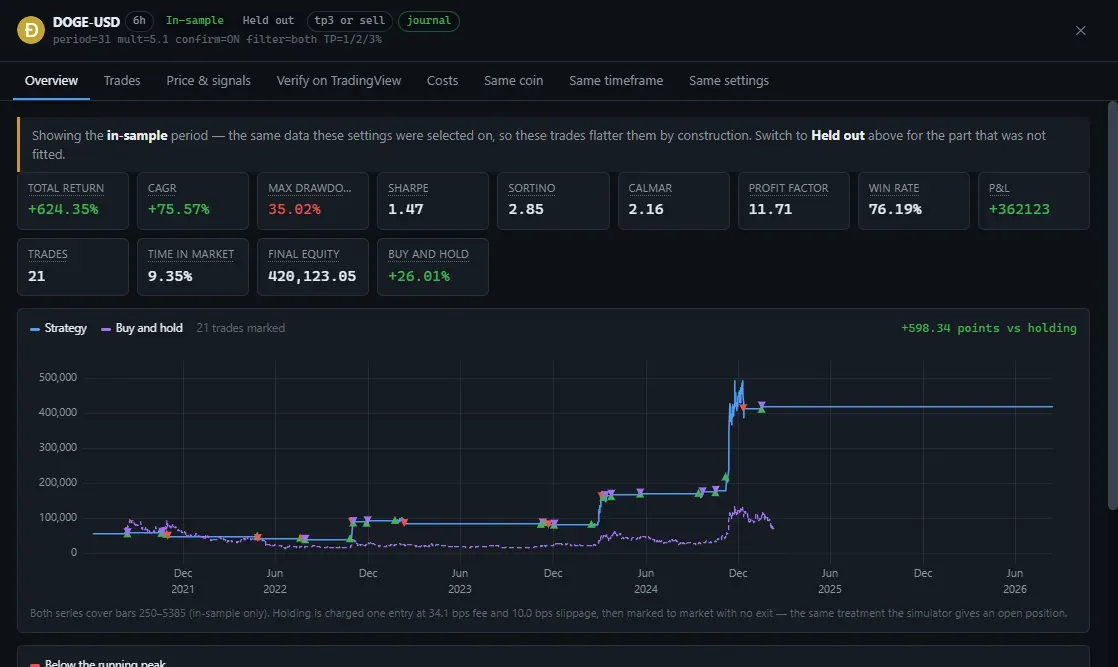
Rank twenty-seven million results by return, read off the top row, and you will always get an answer. It will almost always be a fluke. One parameter combination that happened to catch the biggest move in this particular history, surrounded by neighbours that lost money.
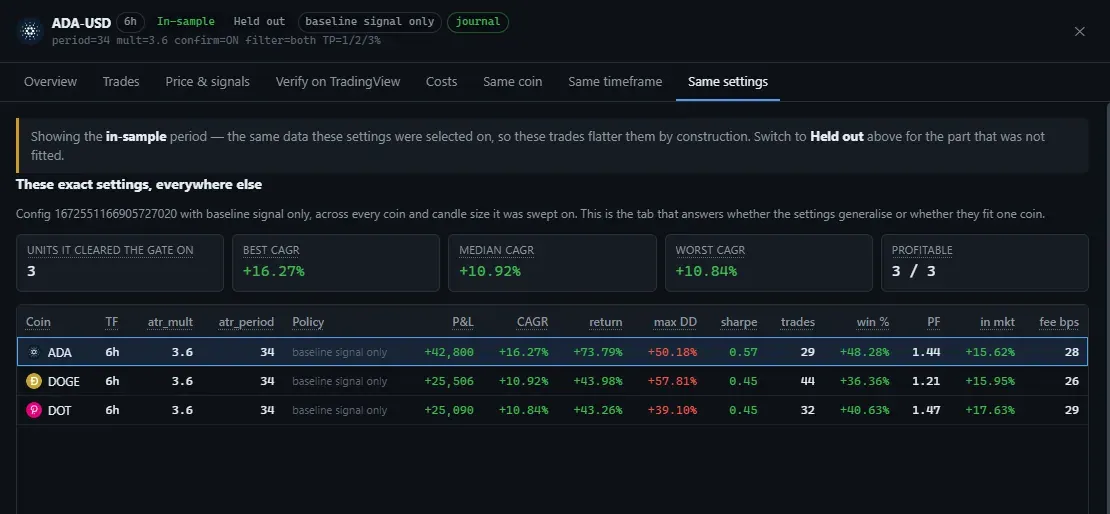
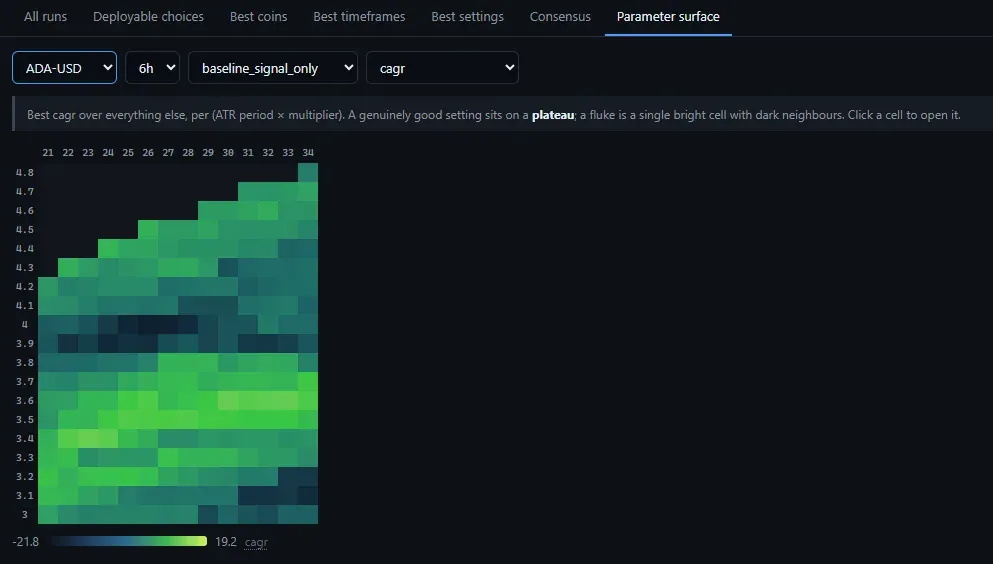
So the default ranking is not return. Each configuration is scored by its neighbourhood in the parameter grid rather than by itself, because a genuine edge sits on a plateau while a fluke sits on a spike and the spike's neighbours drag it down. Raw metrics stay available, and are labelled as unguarded wherever they appear. Every run is split into a tuning period and a held back period shown side by side, and settings are ranked by their median rank across markets, so one lucky instrument cannot carry a result.
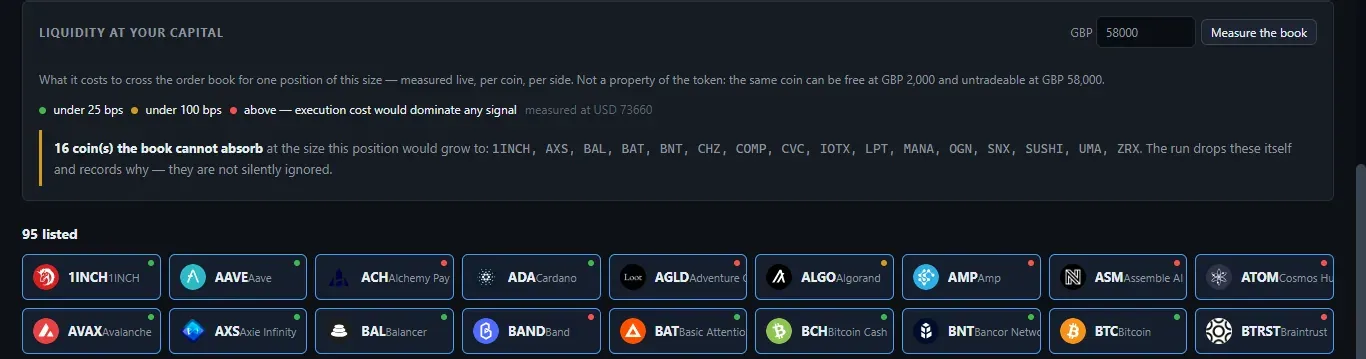
Costs are modelled to the same standard. The exchange fee tier is solved per configuration, from the volume that configuration would itself have traded. Slippage walks a real order book snapshot at the size of each individual fill, because depth cost is steeply convex. The same instrument costs 39 basis points on a £2,000 order and 6,907 on a £58,000 one, and positions compound as a run succeeds, so pricing that with a single average figure would systematically undercharge precisely the configurations that win.
The value of the tool is not that it finds winners quickly. It is that it says plainly when a setting will not hold up, before capital follows it rather than after.
Engineered for the answer, not the headline.
Software that earns trust by showing its working.
Start the journey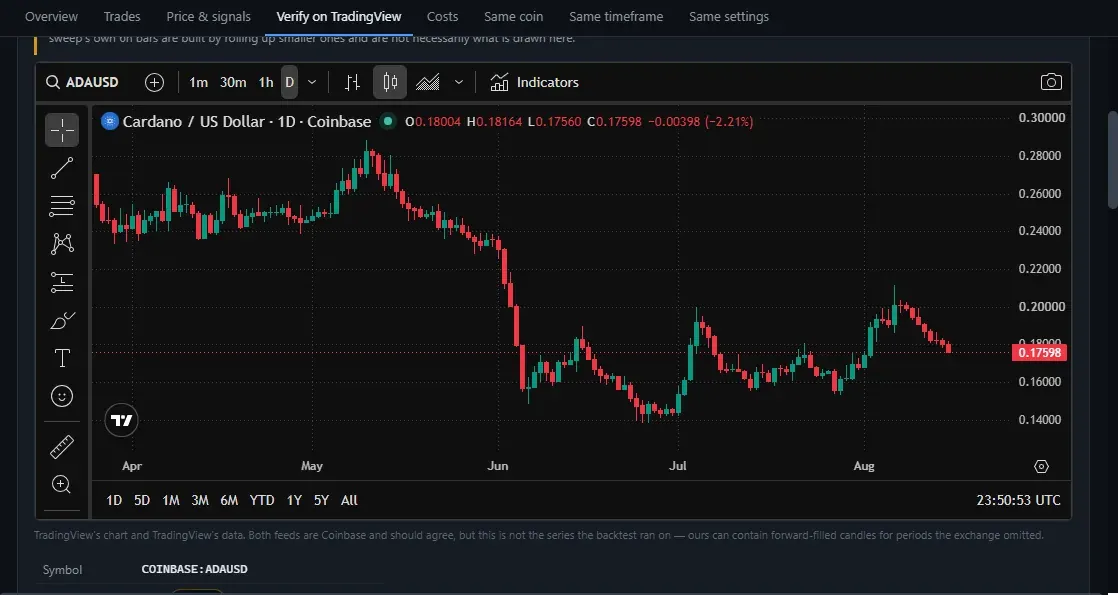
The outcome
A quantitative research desk that opens from a double-click.
ROMLAB ships as a desktop application. It finds or installs Python, builds its own private environment beside itself, and opens a native window. The person using it never meets a terminal or a package manager, and nothing is installed across the rest of the machine.
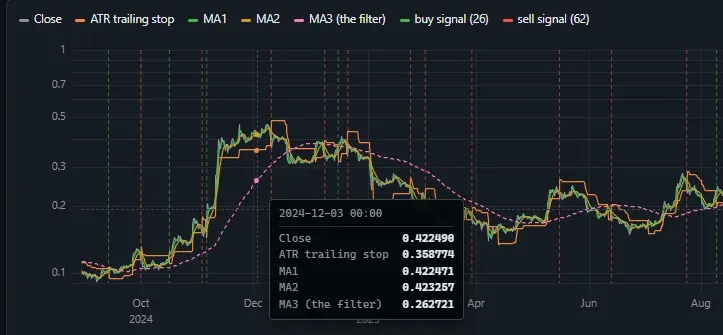
Inside it: a planning wizard that estimates runtime and disk cost before a sweep starts, leaderboards for the best settings, markets and candle sizes, a parameter surface you can jump into from any winning row to see whether its neighbours agree, per-trade excursions, equity curves and full fee and slippage breakdowns, and a live market panel with candles, order book and depth priced at the position size actually being planned.
Every column heading, metric and filter explains itself on hover from a single shared glossary, written against what the engine computes rather than the textbook, because on several of them the two differ and the difference is the entire point. A verification tab sets up a manual parity check against the charting platform, naming the exact symbol, interval, timezone and settings to use, and the four things that would silently invalidate the comparison, stated before the table rather than discovered halfway down it.
And when a sweep that has been running for forty minutes finishes, the machine sounds an alarm loud enough to hear from another room, with a different tone for success and for failure. A small thing. Also the difference between walking away from a long run and sitting in front of it.
Start the conversation
Let's discuss your project.
Share your goals and challenges. We'll respond within one working day.
What happens next
We'll review your message and respond within one working day.
We'll arrange a short call to understand your goals.
You'll receive a clear recommendation, not a generic proposal.
Work that
speaks for itself.
Every project is built with precision. See what we've delivered for businesses like yours.
See our other work